Transparency Dashboard
Public Safety Data
The Cornell Public Safety statistics shared here relate to call volume and types of calls on Cornell’s campus, up to and including the most recent calendar year (2024). Call volume in 2024 was 4.8% higher than in 2020.
While the Public Safety Communications Division receives in excess of a seventy-five thousand calls per year, approximately 44,000 required an officer or an emergency responder’s presence on scene last year. These calls include wellbeing checks of individuals, calls for alarms, and found and lost property. A CAD call for service (CFS) is a computer-generated record to log information regarding incoming police, fire, medical, and emergency calls that originate via phone, email, RAVE Guardian, and Blue Light.
Source of Calls for Service
71 % Officer Initiated (Proactive)
29 % Community Initiated (Reactive)
The majority of calls for service to CUPD in 2024 are related to community safety and wellbeing on campus (e.g. property or building safety check, medical emergency, found/recovered property, traffic concerns) rather than incidents of crime or reported crime. Statistics about where calls for service originate shows that 71% of calls for service are proactive – generated by officers initiating activity – and 29% are reactive (as a result of community members calling for assistance).
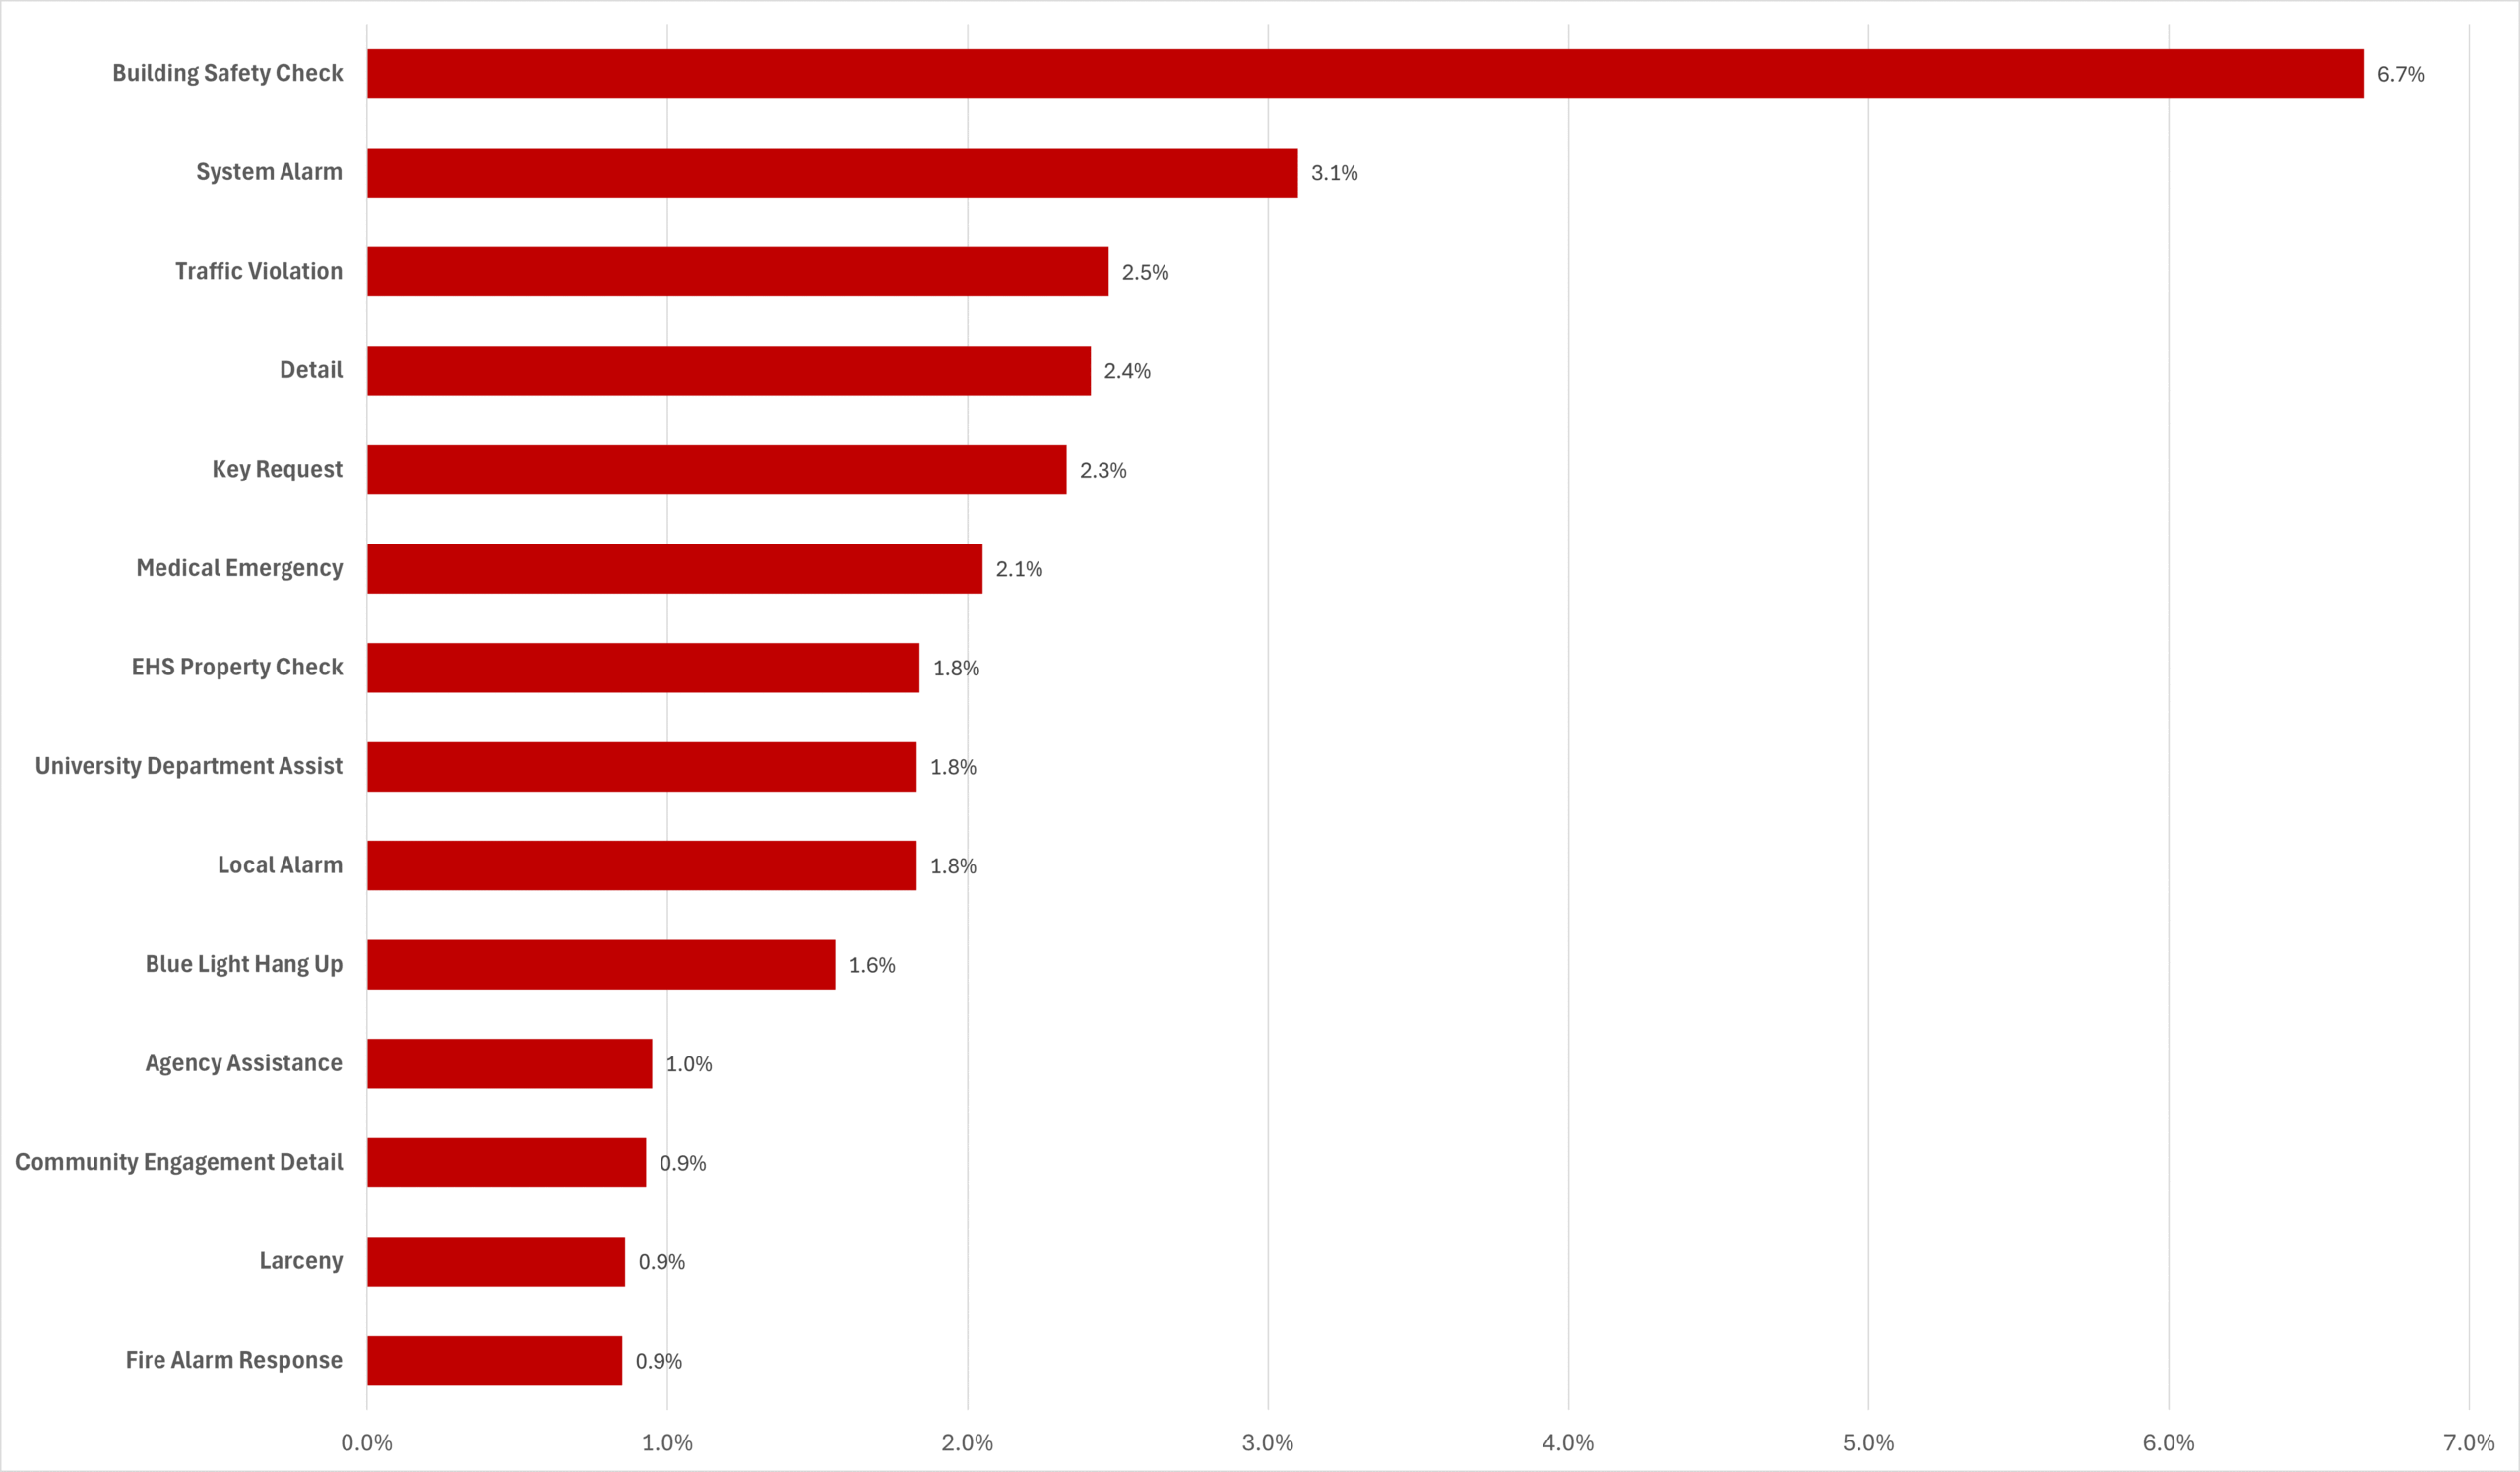
Nature of top 15 call types in 2024
Examining 2024 data, we find that the following categories constitute 89.2% of the types of calls: Property Safety Checks, Building Safety Checks, System Alarm, Traffic Violation, Detail, Key Request, Medical Emergency, Environmental Health and Safety property check, Local Alarm, University Department Assist, Blue Light Hang Up, Agency Assist, Community Engagement Detail, Larceny, and Fire Alarm Response.

Of the various responses to incidents, crimes and violations are tallied in Cornell’s yearly Jeanne Clery Act report, a federally required accounting of crime on and around college and university campuses. These crimes include: murder, manslaughter, aggravated assault, sex offenses (including rape, fondling, incest and statutory rape), robbery, burglary, motor vehicle theft, arson, domestic violence, dating violence, and stalking.
State and National Reporting
In addition to Clery reporting to the US Department of Education, Cornell University reports crime to the New York State Department of Criminal Justice Services (DCJS). Statistics are compiled statewide for the more than five hundred criminal justice agencies within New York. DCJS compiles these reports as New York’s official crime statistics and submits summary crime data to the FBI for a picture of crime nationwide.
Crime and Incident Analysis
Locally, Cornell Police analyze incident reports to identify trends, hot spots, and other spatial and temporal patterns of disorder. These analyses are used to proactively address emerging problems within the campus community. Crime analysis provides intelligence for specific engagement and crime prevention activities that could include education; target hardening; increased outreach; additional vigilance; and patrols in areas of high activity.
Daily crime summary reports and crime alerts are found in the following locations:
Examples of targeted crime pattern analysis include:


